
OpenSource Traefik ratings with Matomo

Some time ago, I talked to you about tracking and why I care about my privacy. In my conclusion, I indicated that user tracking was still a useful tool for a company, as long as it was ethical and respectful of users.
However, very often, I see that Google Analytics is used by the sites I browse on. It is far (even very far) from being respectful of your users' data. Even worse! You allow Google to know the activity of your site from end to end and to know how to better target its ads (among others).
Today, I propose you see how it is possible to track users while showing respect for them.
What is Matomo?
Matomo is an OpenSource alternative to Google Analytics. Available on GitHub, it allows you to deploy a complete application with a dashboard and a tracking system in JavaScript. It is also possible to rely on reading server logs rather than JavaScript.
 matomo-org
Having an open source solution allows you to know its intricacies, but above all and the guarantee of respect for your users. The free software carries today the majority of the internet (including this web site).
Matomo allows you to have the statistics classically used as (in a non-exhaustive way):
- The visited pages
- The "User Agent" (OS, Browser, language, etc.)
- The transformation rate of social networks
- The GeoIp
- The bounce rate
- The duration of sessions
Based on the classic, but efficient PHP + MySql couple, the application is light and also integrates components aimed at respecting privacy:
- Support of the DoNotTrack header, which allows you to indicate that you do not want the website to track your activity
- Support for RGPD constraints (informed consent), it is possible to activate or deactivate Matomo directly for each user
- Native anonymization or pseudoanonymization of data
Thus it is possible to have clear and complete statistics without being intrusive.
Note that there is also a solution managed directly by Matomo, available on their website.
 Himanshu Sharma | Digital Marketing Consultant
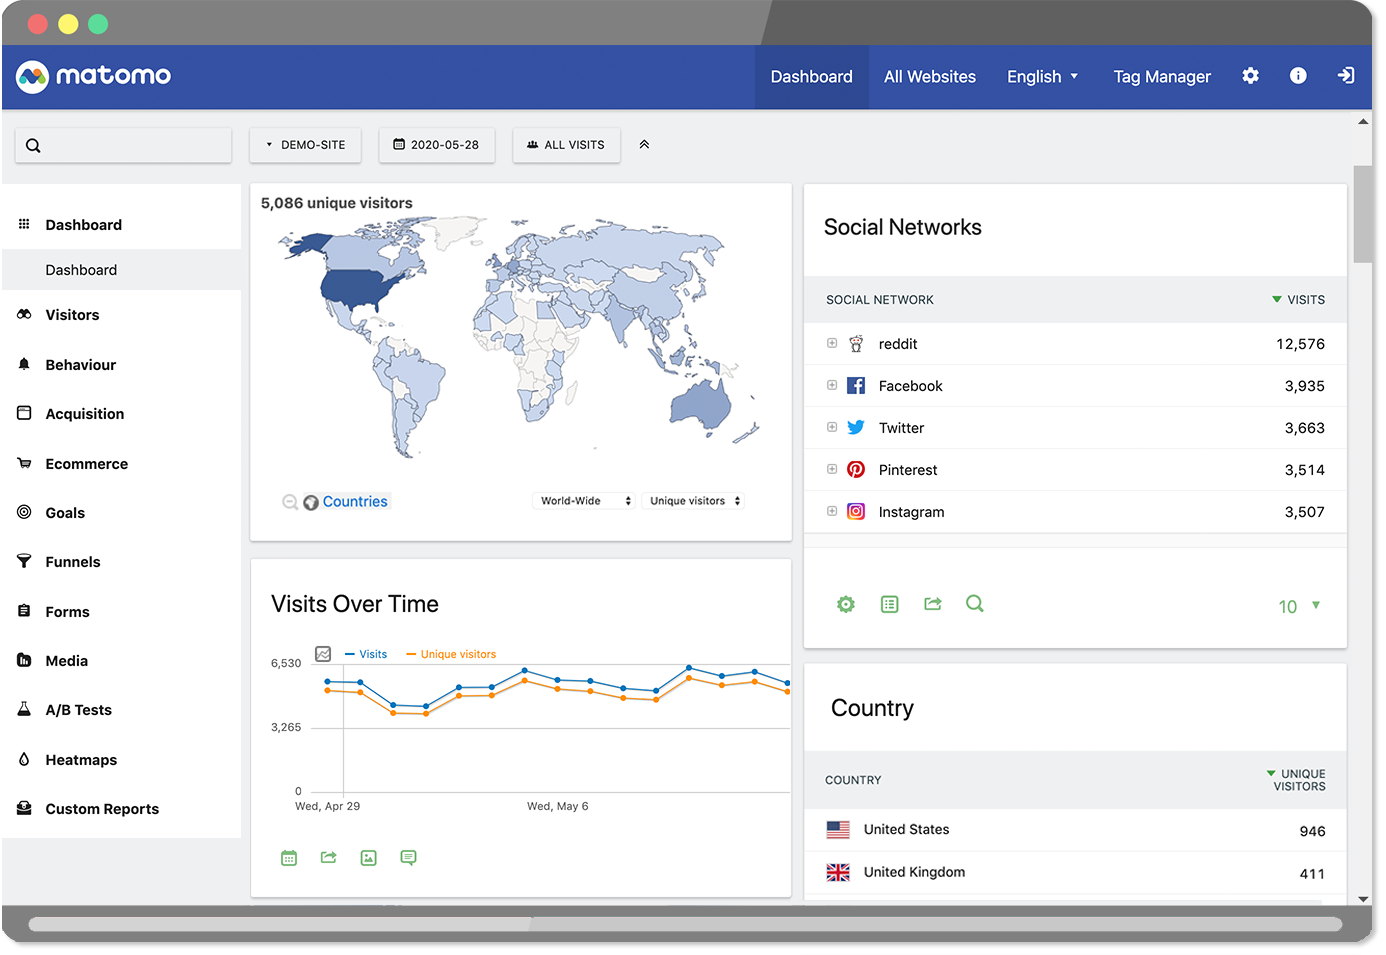
In the case I'm going to present today, we'll start from the official docker image.
Deploying Matomo in Kubernetes
As usual on this blog, I'm going to talk about deploying in Kubernetes, because that's what I have on hand and it's becoming more and more common today.
As a reminder, my deployment is not a "prod ready" deployment in enterprise, it doesn't handle high availability and scaling is catastrophic since the database is in the same pod. This post is simply a "demo" of what is possible so you can easily adapt it to your needs. The idea is, of course, that you can make the tool your own.
Although the deployment is in Kubernetes, it remains easily transposable to Docker or Docker-compose (or podman, or rancher, etc.).
So here's the deployment we're going to do, in blue are the elements we're going to create:
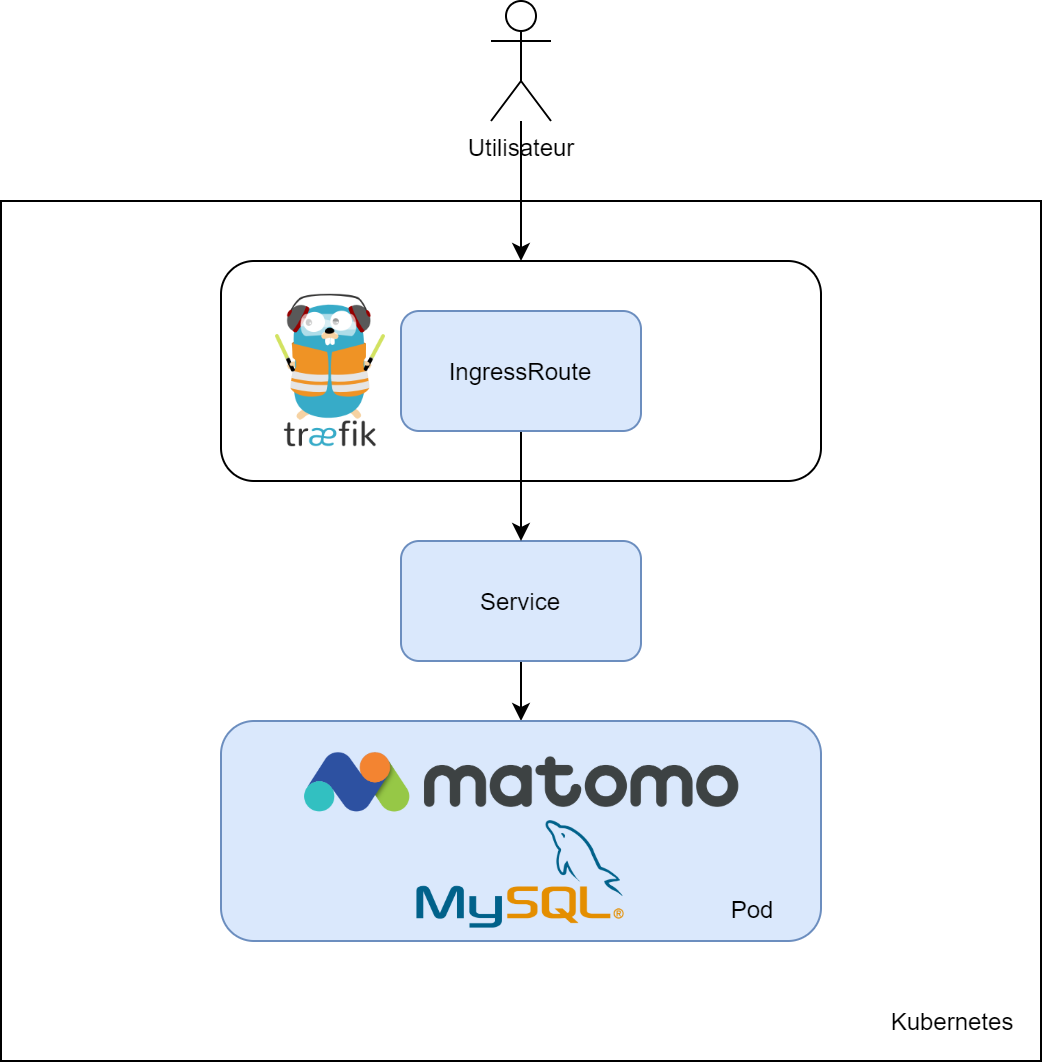
So we will have 3 yaml files:
- A "deployment" carrying Matomo and MySql
- A "service" allowing exposing Matomo
- IngressRoute allowing Traefik to serve Matomo and manage its TLS certificate
The deployment
We are here on something very basic:
- Two images (Matomo and MySql)
- A database configuration (user, default database, etc.)
- Some persistent storage
apiVersion: apps/v1beta1
kind: Deployment
metadata:
  name: matomo
  labels:
    app: matomo
spec:
  replicas: 1
  selector:
    matchLabels:
      app: matomo
  template:
    metadata:
      labels:
        app: matomo
    spec:
      containers:
      - name: matomo
        image: matomo:4.1.1-apache
        imagePullPolicy: Always
        ports:
        - containerPort: 80
        env:
        - name: MATOMO_DATABASE_HOST
          value: 127.0.0.1
        - name: MATOMO_DATABASE_USERNAME
          value: "root"
        - name: MATOMO_DATABASE_PASSWORD
          value: "matomo"
        - name: MATOMO_DATABASE_DBNAME
          value: "matomo"
        volumeMounts:
        - name: matomo-storage
          mountPath: /var/www/html/config
      - name: mysql
        volumeMounts:
        - name : mysql-storage
          mountPath: /var/lib/mysql
        image: mysql:8.0.23
        imagePullPolicy: Always
        ports:
        - containerPort: 3306
        env:
        - name: MYSQL_ROOT_PASSWORD
          value: "matomo"
        - name: MYSQL_DATABASE
          value: "matomo"
        resources:
          limits:
            cpu: "0.2"
            memory: "512Mi"
      volumes:
      - name: mysql-storage
        hostPath:
          path: /home/kube/matomo/content/mysql
          type: Directory
      - name: matomo-storage
        hostPath:
          path: /home/kube/matomo/content/matomo
          type: Directory
We find, first of all, the Matomo container, based on an Apache image.
This last one has as configuration :
- A binding on port 80 of the pod
- The configuration of the database. In my example, I don't need to put a strong password, because the database is dedicated to Matomo and is only accessible by the latter.
- A persistent storage. This allows Matomo to store its configurations locally (especially the database configuration). This configuration is not valid for a high availability deployment, as I use local storage
Then, we have a second container that carries the MySql database, with the following configuration:
- Logins and passwords on the database
- The binding of port 3306 inside the pod only, so only accessible by Matomo
- A persistent storage : I don't want to lose my data at the slightest reboot. Once again, this configuration is not valid for a high availability deployment.
Then, we have a service, which will allow us to expose Matomo :
kind: Service
apiVersion: v1
metadata:
  labels:
    app: matomo
  name: matomo
spec:
  type: ClusterIP
  ports:
  - port: 80
    name: http
  selector:
    app: matomo
Nothing transcendent here, I simply bind the port 80 of my pod to a Kubernetes ClusterIP.
Finally, I declare IngressRoute, this is the one that will allow Traefik to route traffic to my pod.
kind: IngressRoute
metadata:
  name: matomo-tls
  namespace: default
spec:
  entryPoints:
    - websecure
  routes:
  - kind: Rule
    match: Host(`matomo.tferdinand.net`)
    services:
    - name: matomo
      port: 80
    middlewares:
      - name: security
  tls:
    certResolver: le
    options:
      name: mytlsoption
      namespace: default
---
apiVersion: traefik.containo.us/v1alpha1
kind: IngressRoute
metadata:
  name: matomo
  namespace: default
spec:
  entryPoints:
    - web
  routes:
  - kind: Rule
    match: Host(`matomo.tferdinand.net`)
    services:
    - name: matomo
      port: 80
    middlewares:
      - name: security
      - name: redirectscheme
We find here 2 blocks, one in HTTP and one in https, with an automatic redirection from one to the other.
Then, we can see that I assign the DNS record "matomo.tferdinand.net" to this one.
Finally, I apply the same security patterns that I had described in one of my previous posts.
I can now apply my 3 configurations.
Configuring Matomo
Configuring the server
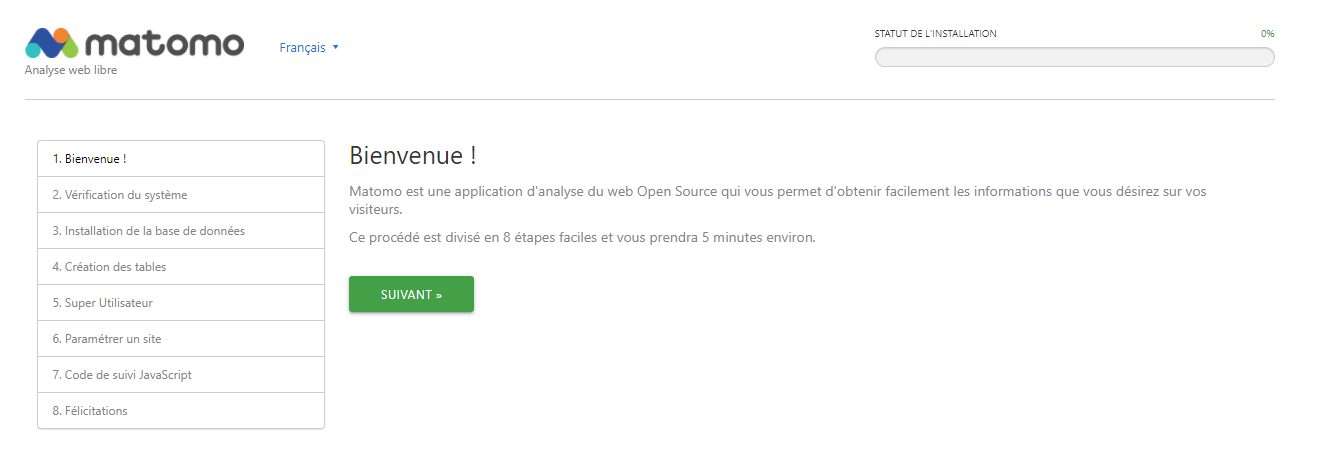
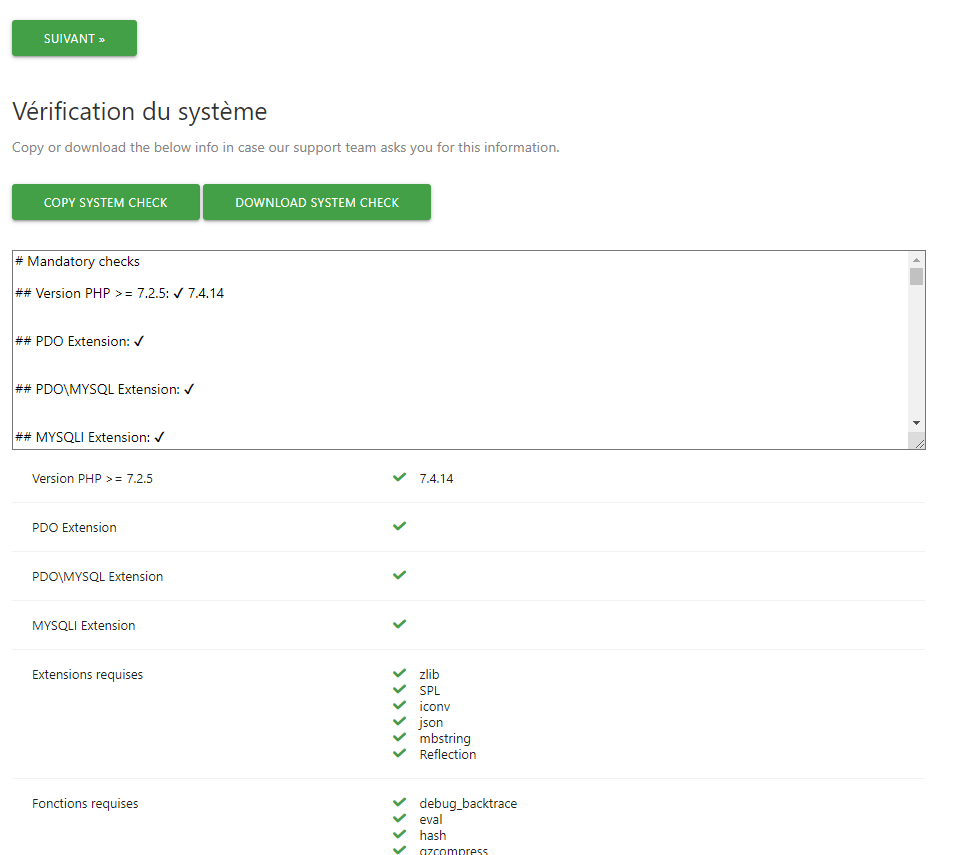
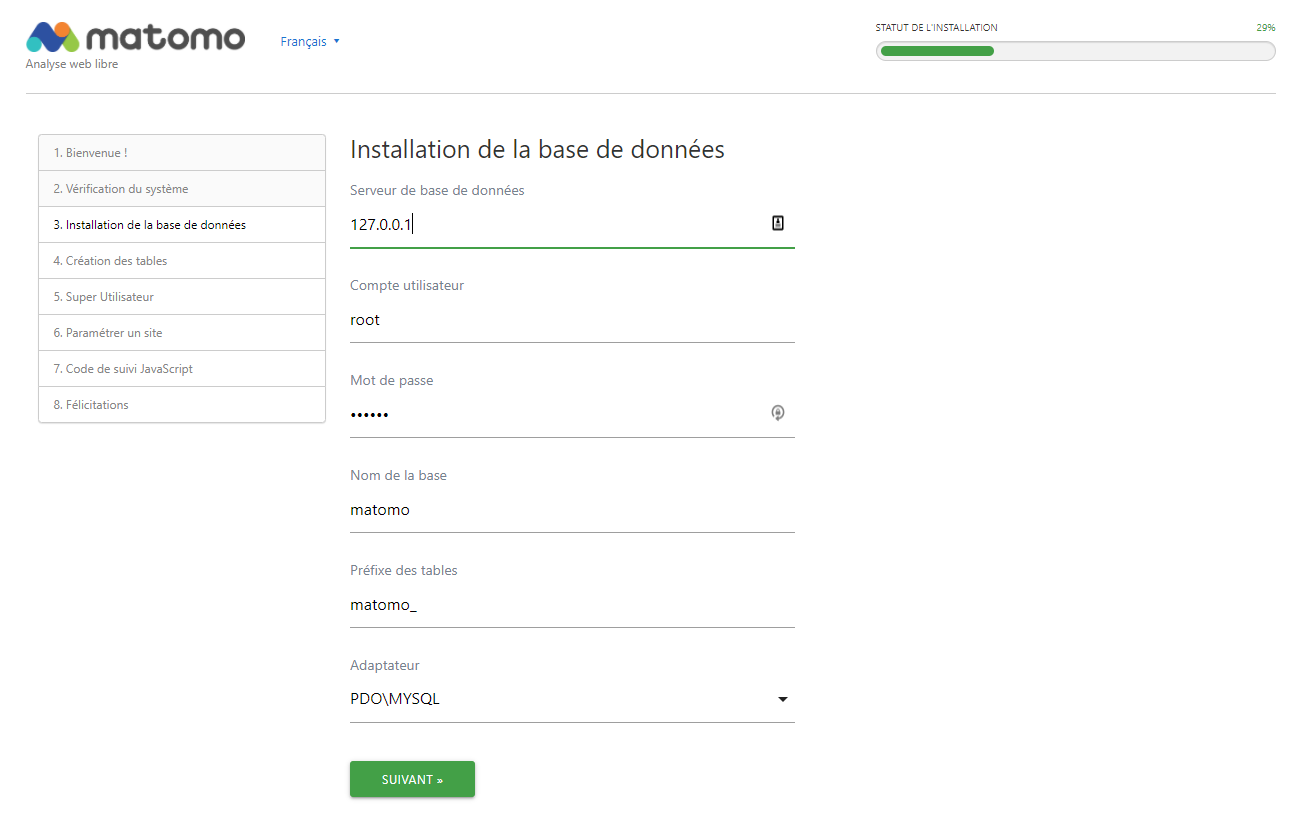
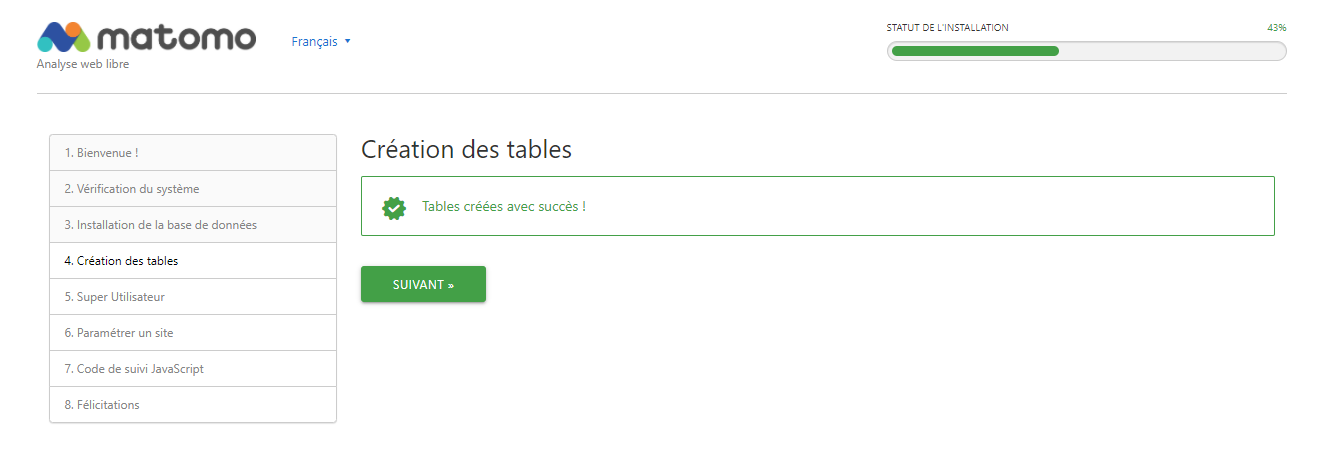
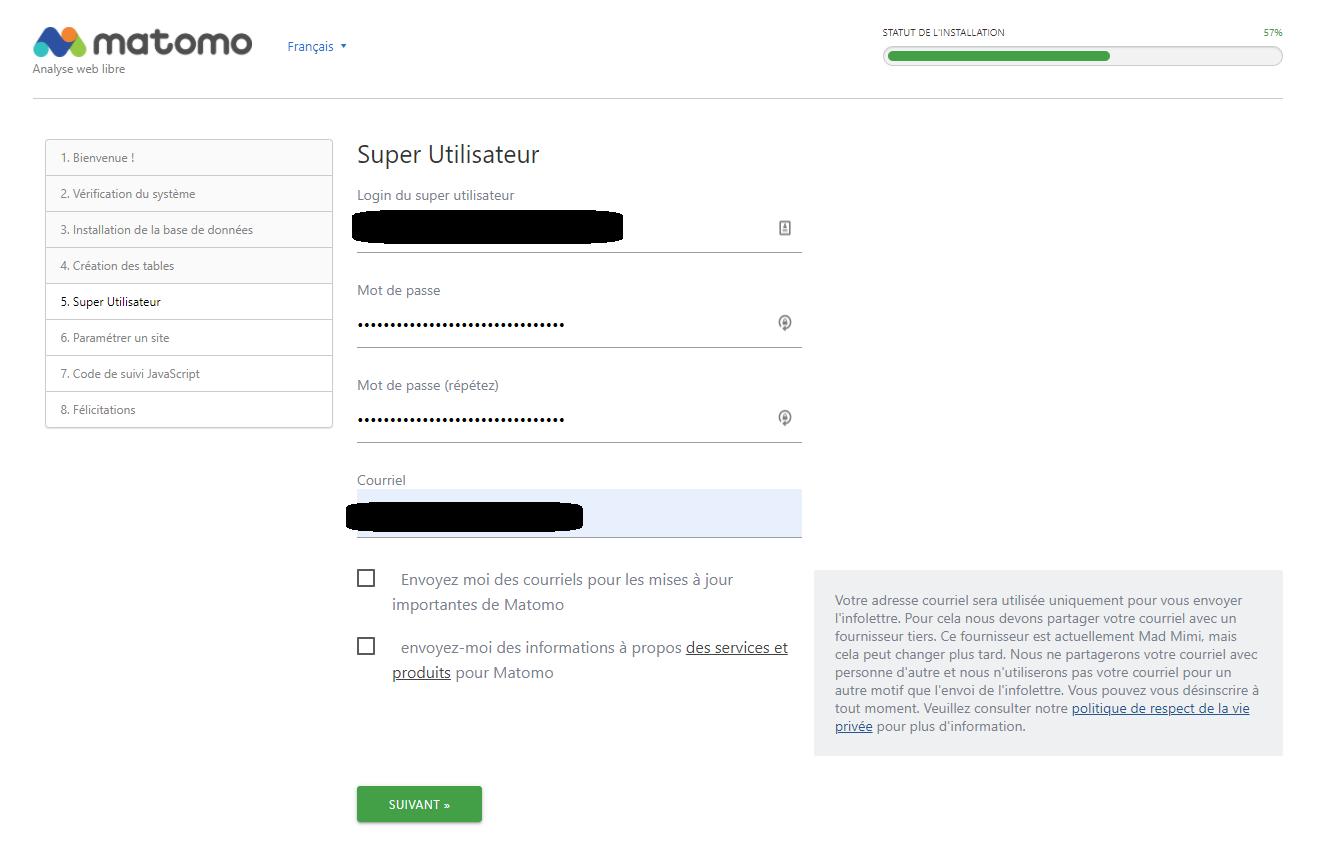
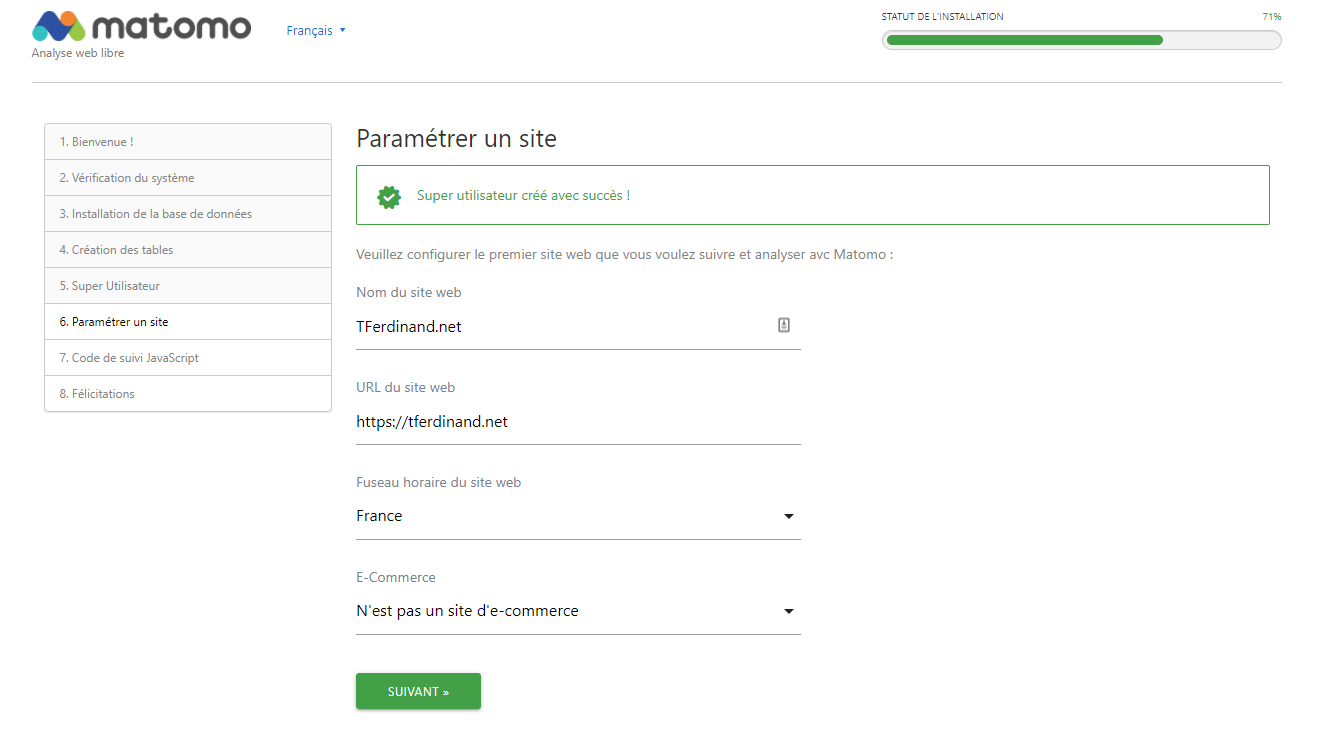
By connecting to the address declared in Traefik, you should see the installation wizard.
It will guide you step by step to :
- Configure your database
- Configure your first administrator user
- Configure your first site
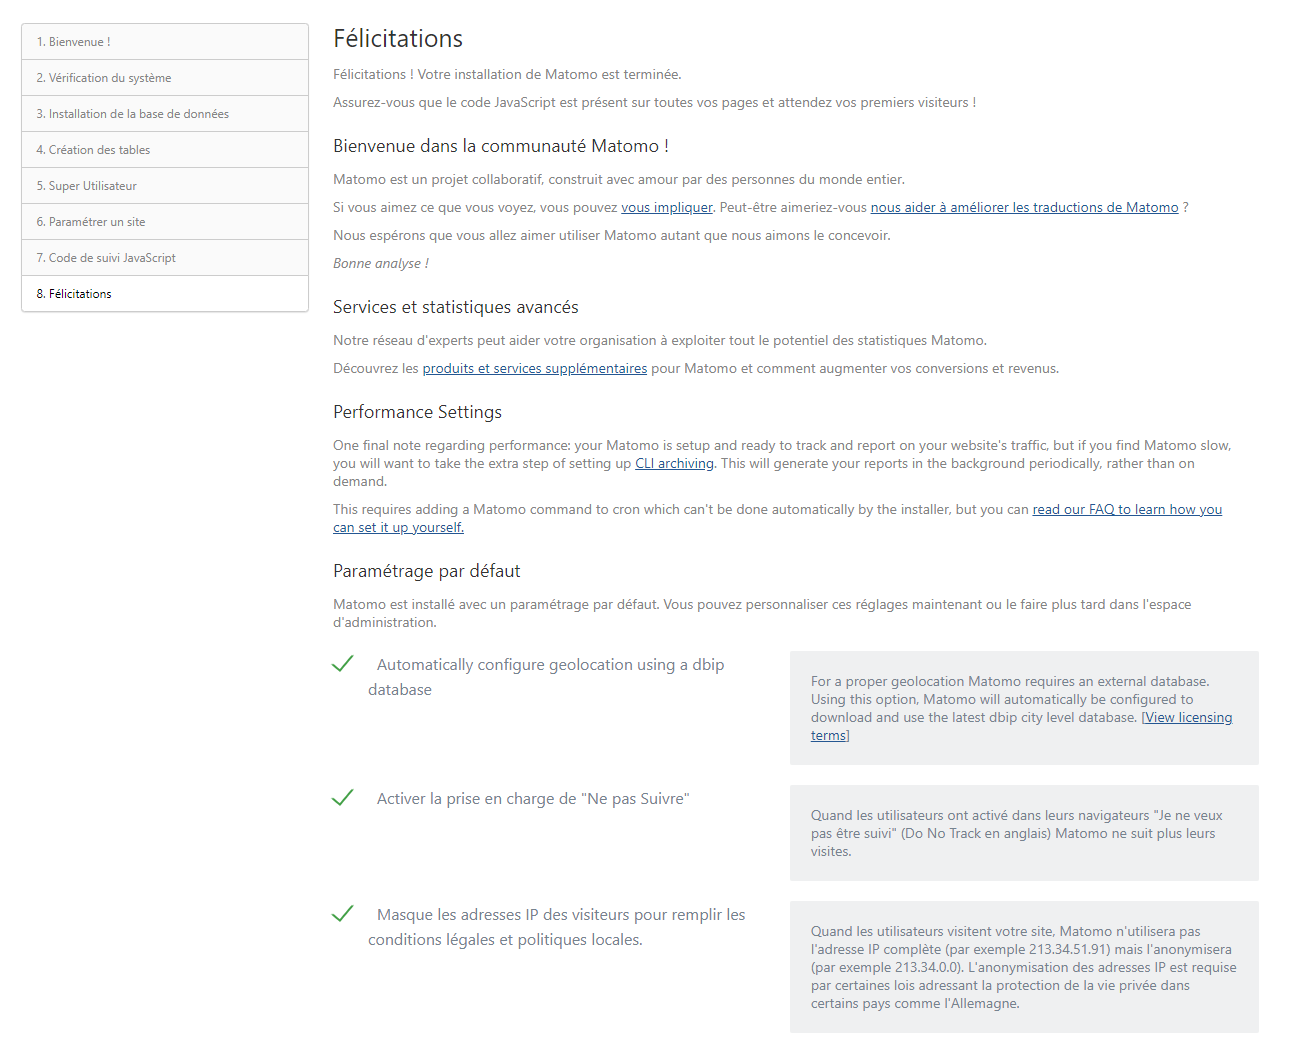
You can see all the steps below:
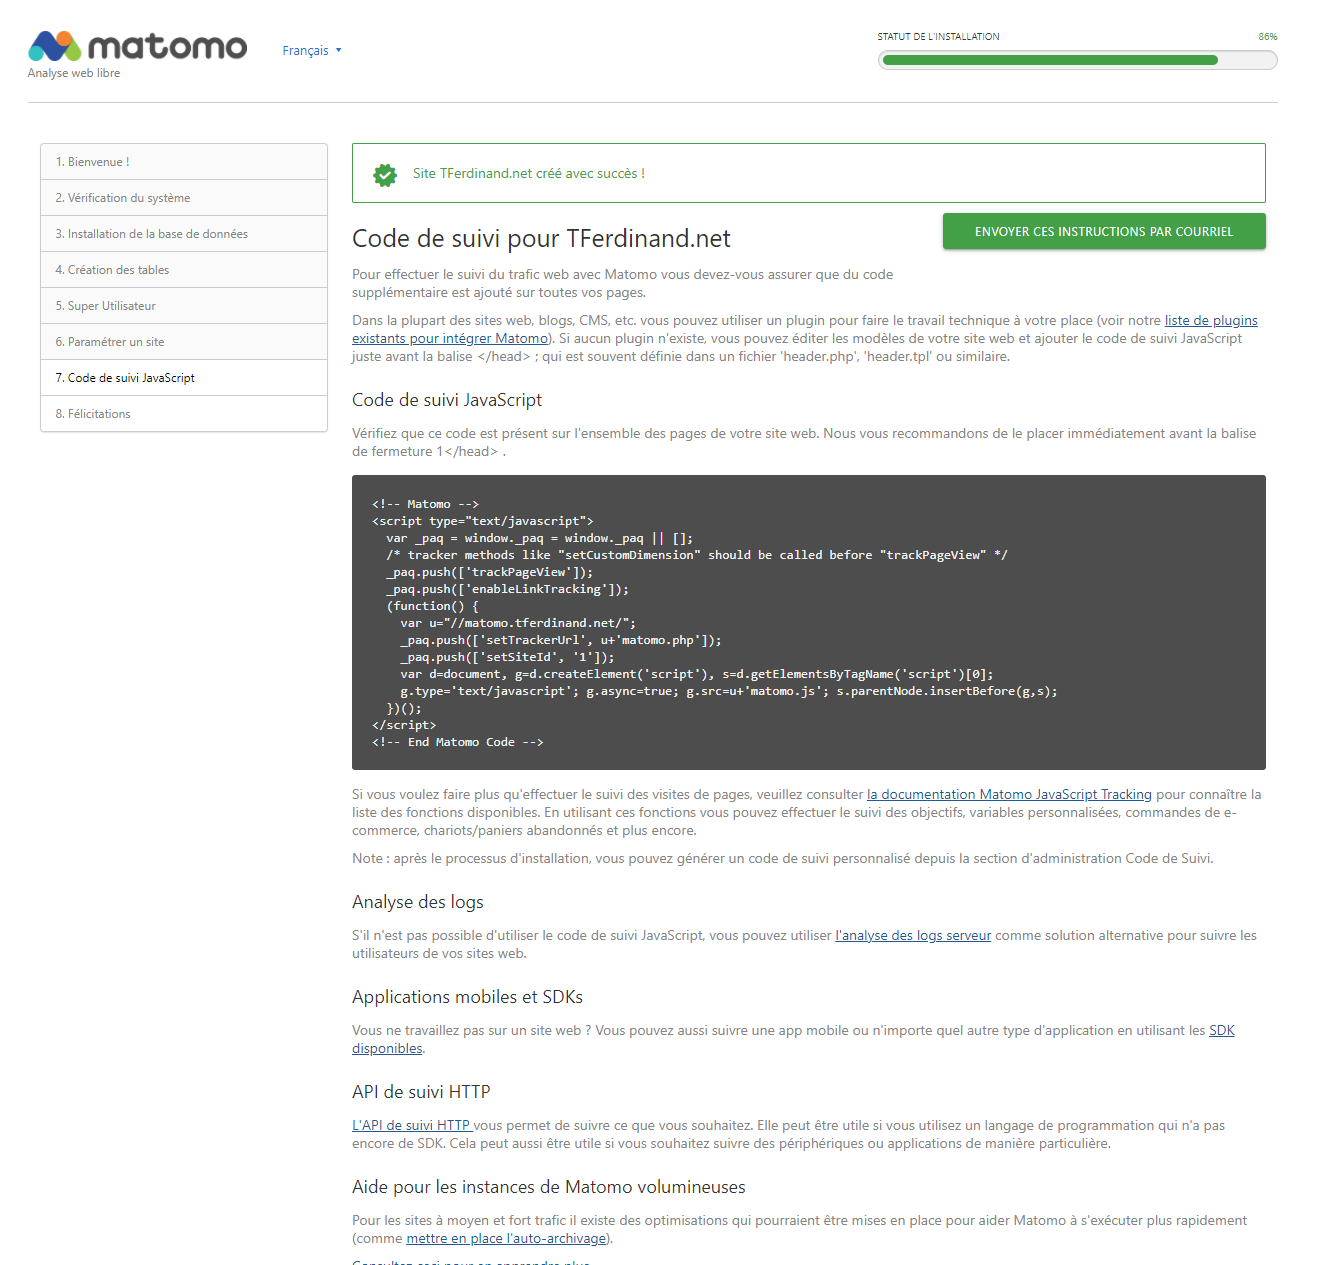
Integrate the js tracker
As you could see, Matomo works via a JavaScript tracker to be integrated in your website.
It is this last one which will interact with the client to give the necessary information.
To activate Matomo on my site, I just have to integrate this code. In the case of Ghost, my blog, I have a parameter for that in "Code injection" > "Site headers".
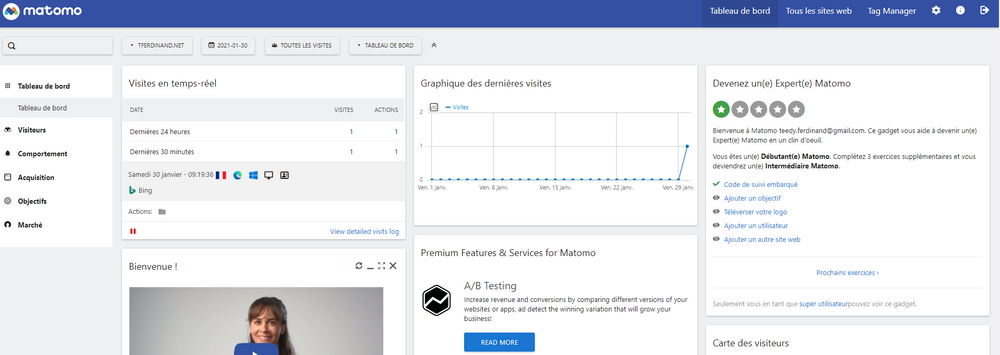
When you connect to the Matomo interface, you should see some traffic, taking into account that :
- Browsers sending DNT (Do Not Track) header will not send any information (like Brave for example)
- From an RGPD perspective, you must obtain the user's consent before collecting their information and placing a cookie on their computer. Matomo provides a guide to this (https://matomo.org/docs/gdpr/).
To go further
It is also possible, as I mentioned above, to couple Matomo to log files.
There is indeed a python script delivered in the Matomo image which allows you to do this action, starting from known log formats, but also to define custom formats.
To use this script, there are two prerequisites:
- Python 3.x
- PHP 7.x
However, the image used above is indeed based on the official PHP image, as can be seen on the GitHub repository, but does not have Python installed.
matomo-orgIf you want to use this script, there are two solutions:
- Create a custom image for this script with Python and PHP
- Start from the official image by adding PHP, like this
FROM matomo:4.1.1-apache
RUN apt update -y
RUN apt install -y python3
RUN apt-get purge -y --auto-remove && rm -rf /var/lib/apt/lists/*
The script is then easily usable, as indicated in the official documentation :

Regarding the authentication, three solutions are possible. Either you are in the image that runs the application, and the script will be able to exploit directly the configuration files and thus connect directly.
The second solution is to create a token which will allow you to authenticate yourself and to pass it in the parameter with the switch --token-auth, this token can be created from the interface of Matomo. To do so, you just have to click on the cog in the top right corner, then "Security" and "Create a new token".
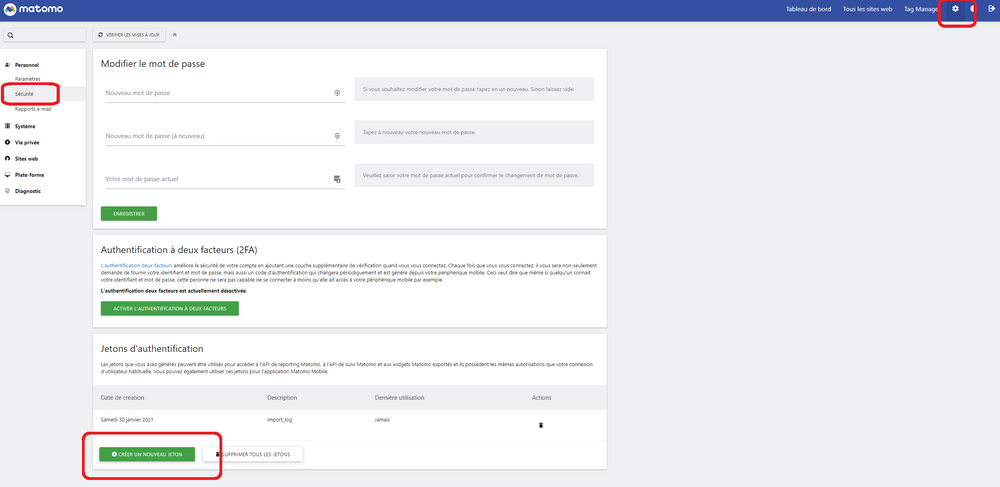
Be careful, the token can only be recovered once, so don't forget to store it in a secure environment.
Finally, the third solution, which I strongly advise against, it is also possible to pass directly a login and password in command line.
Importing logs with a Kubernetes cronjob
For my part, I chose to import the logs by using a Kubernetes cronjob.
Indeed, I chose not to deploy the javascript that I find too intrusive for you, my visitors. So I chose to analyze the raw logs provided by Traefik.
I also chose not to use the official image for this purpose and I use a token authentication.
The image
The docker image I used is quite basic:
FROM python:3.8.7-buster
RUN apt update\
	&& apt install git \
	&& git clone https://github.com/matomo-org/matomo-log-analytics.git \
	&& rm -rf /var/lib/apt/lists/*
I start from a python 3.8 image (because the importer is only compatible with some versions) then I clone the associated repository.
You can get the image directly created via dockerhub :
The job
I chose to put my Traefik logs in a directory that I can mount when I need it.
To know more about logs configuration, I invite you to read my article on this subject :
 Teddy FERDINAND
I then created a Kubernetes cronjob, which will allow me to read the logs at regular intervals to integrate them into Matomo.
apiVersion: batch/v1beta1
kind: CronJob
metadata:
  name: matomo-importer
spec:
  schedule: "5 * * * *"
  jobTemplate:
    spec:
      template:
        spec:
          containers:
          - name: matomo-importer
            image: tferdinand/matomo-log-importer:1.0.0
            imagePullPolicy: IfNotPresent
            env:
              - name: PROCESSING_DATE
                value: $(date -d "1 hour ago" "+%d/%b/%Y:%H")
              - name: TOKEN
                value: "xxxxxxxxxxxxxxxxxxxxxxxxxxxxxx"
              - name: TRAEFIK_INGRESS_ID
                value: "default-traefik-web-ui-tls-c463f039d72c55f0aca6"
              - name: ID_SITE
                value: 1
            command:
            - /bin/bash
            - -c
            - grep $(TRAEFIK_INGRESS_ID) /tmp/access.log | grep $(PROCESSING_DATE) > /tmp/matomo_$(ID_SITE).log; python matomo-log-analytics/import_logs.py  --url=https://matomo.tferdinand.net --idsite=$(ID_SITE) --debug --token-auth $(TOKEN) --log-format-name=common /tmp/matomo_$(ID_SITE).log
            volumeMounts:
            - name: shared-storage
              mountPath: /tmp/
          restartPolicy: OnFailure
          volumes:
            - name: shared-storage
              hostPath:
                path: /home/kube/share/from_traefik
                type: Directory
So I run this task once an hour, to process the previous hour.
The "grep" that we see at the beginning allows me to output only the logs for the service I want, the Matomo log importer not knowing how to handle the format of the traefik logs in a more refined way.
ID_SITE allows me to indicate the site ID on Matomo, by default 1.
So, every hour, I can follow the site's traffic, without impacting my users. Note that it is possible to go down to the minute by adjusting the parameters.
In conclusion
Matomo is a reliable alternative that is more respectful of your users. It is completely possible to consider it in a professional environment.
If you have a need for more consistent statistics on your site, it is inherently better for your users to use this solution than Google Analytics.
Moreover, hosting the solution yourself also allows you to respect the constraints more easily related to the RGPD. The openness of the code also guarantees that no third party exploitation of the data is made.
I also insist on the fact that not all sites need complete tracking, for my part, a simple exploitation of the logs allows me to get consistent data.


Comments ()