
Extraction of Traefik accesslogs and dashboard creation

A few weeks ago, I wrote an article explaining the migration from Traefik 1 to Traefik 2, but this time I propose to address a crucial point in the implementation of an application, its monitoring.
This article explains how I set up my dashboarding, it doesn't explain in any case the "enterprise" dashboarding that should be more reliable and complete on some points.
During this article, I will explain how to create this type of dashboard in a very basic way.
Technologies used
To set up this dashboard, I used three separate applications:
- ElasticSearch: ElasticSearch is a product to index and search data, it is often used in ELK stacks (ElasticSearch LogStash Kibana) for logging or stand alone as a search engine.
- FileBeat : FileBeat is a lightweight log extractor created by Elastic.co, editor of ElasticSearch, its model is adapted to containers. Note that FileBeat can also run in DaemonSet standalone to extract logs from a complete Kubernetes cluster.
- Grafana: Grafana allows to create dashboards from multiple data sources, including ElasticSearch, used here.
Step 1: Setting up ElasticSearch
In the model I propose, ElasticSearch will be used to store and index our logs. We will therefore deploy ElasticSearch in a pod to exploit it later. So we create the following description file :
apiVersion: apps/v1beta1
kind: Deployment
metadata:
  name: elasticsearch
  labels:
    app: elasticsearch
spec:
  replicas: 1
  template:
    metadata:
      labels:
        app: elasticsearch
    spec:
      containers:
      - name: elasticsearch
        image: elasticsearch:7.5.1
        imagePullPolicy: Always
        ports:
        - containerPort: 9200 # Port de requête
        - containerPort: 9300 # Port d'administration
        env:
        - name: discovery.type
          value: single-node  # Indique à ElasticSearch de fonctionner en mono noeud
        resources:
          limits:
            cpu: "0.5"
            memory: "2048Mi"  # Ram minimal requise

---
kind: Service
apiVersion: v1
metadata:
  labels:
    app: elasticsearch
  name: elasticsearch
spec:
  type: ClusterIP
  ports:
  - port: 9200
    name: http
  - port: 9300
    name: http2
  selector:
    app: elasticsearch
As indicated, in applying the latter, we will deploy :
- A pod containing ElasticSearch as a single node
- A service to expose the query and administration port of ElasticSearch
Important Information - Production Environment :
In a production environment, in a company, the following data will be taken into account to create our ElasticSearch cluster:
- Running minimum with 3 nodes
- Activating persistent storage : For my part I do not consider this data as critical, in company we will choose to persist the data
Enable authentication on ElasticSearch
You can find this information on the official website.
Step 2: Setting up a sidecar with FileBeat and Traefik configuration
In this second stage, we will:
- Configure Traefik to write its accesslogs in /var/log/traefik/access.log
- Deploy FileBeat with the Traefik module, which will allow it to map log fields natively.
- Create an emptyDir that will serve as a directory of exchange between our two containers in the pod.
I'm not going to go back to the Traefik installation, which I described in my previous article. In a simple way, my Traefik pod runs in a dedicated namespace, and in a DaemonSet.
So we will modify this DaemonSet to add our second container and our exchange directory.
apiVersion: extensions/v1beta1
kind: DaemonSet
metadata:
 name: traefik-ingress-controller
 namespace: traefik
 labels:
   k8s-app: traefik-ingress-lb
   kubernetes.io/cluster-service: "true"
spec:
 template:
   metadata:
     labels:
       k8s-app: traefik-ingress-lb
       name: traefik-ingress-lb
   spec:
     hostNetwork: true
     dnsPolicy: ClusterFirstWithHostNet
     serviceAccountName: traefik-ingress-controller
     terminationGracePeriodSeconds: 60
     tolerations:
     - key: node-role.kubernetes.io/master
       effect: NoSchedule
     containers:
     - image: traefik:v2.1.1
       name: traefik-ingress-lb
       imagePullPolicy: Always
       volumeMounts:
         - mountPath: "/var/log/traefik"
           name: logs
         - mountPath: "/cert/"
           name: cert
       resources:
         requests:
           cpu: 100m
           memory: 20Mi
       args:
       - --providers.kubernetescrd
       - --accesslog=true
       - --accesslog.filepath=/var/log/traefik/access.log
       - --accesslog.fields.headers.defaultmode=keep
       - --entrypoints.web.address=:80
       - --entrypoints.websecure.address=:443
       - --certificatesresolvers.le.acme.email=masuperadressemail@monmail.com
       - --certificatesresolvers.le.acme.storage=/cert/acme.json
       - --certificatesResolvers.le.acme.httpChallenge.entryPoint=web
       ports:
       - name: web
         containerPort: 80
       - name: websecure
         containerPort: 443
       - name: admin
         containerPort: 8080
     - name: filebeat
       image: docker.elastic.co/beats/filebeat:7.5.1
       args: [
         "-c", "/etc/filebeat.yml",
         "-e",
       ]
       env:
       - name: ELASTICSEARCH_HOST
         value: elasticsearch.default
       - name: ELASTICSEARCH_PORT
         value: "9200"
       securityContext:
         runAsUser: 0
       resources:
           limits:
             memory: 200Mi
           requests:
             cpu: 100m
             memory: 100Mi
       volumeMounts:
         - name: config
           mountPath: /etc/filebeat.yml
           readOnly: true
           subPath: filebeat.yml
         - name: data
           mountPath: /usr/share/filebeat/data
         - name: logs
           mountPath: /var/log/traefik
           readOnly: true
     volumes:
     - name: logs
       emptyDir: {}
     - name: config
       configMap:
         defaultMode: 0600
         name: filebeat-config
     - name: data
       hostPath:
         path: /var/lib/filebeat-data
         type: DirectoryOrCreate
     - name: cert
       hostPath:
         path: /home/kube/traefik/certs/
         type: Directory


---
apiVersion: v1
kind: ConfigMap
metadata:
  name: filebeat-config
  namespace: traefik
  labels:
    k8s-app: filebeat
data:
  filebeat.yml: |-
    output.elasticsearch:
      hosts: ['${ELASTICSEARCH_HOST:elasticsearch}:${ELASTICSEARCH_PORT:9200}']
    filebeat.modules:
    - module: traefik
      access:
        enabled: true
In this block of code, we find:
- Lines 38 to 40 : Add launch parameters to Traefik to activate the accesslog, store them in /var/log/traefik/access.log and keep the headers in the logs (which are dropped by default)
- Line 27 and 28: Addition of the mounting point described below, which allows to have an exchange directory between our two containers.
- Line 53 to 81: Creation of our container running FileBeat, to which we indicate its configuration file, the parameters of the ElasticSearch endpoint and the necessary mount points.
- Line 83 and 84: The emptyDir volume created to exchange between our two containers within the pod
- Line 89-92: Persistent directory on the host that allows FileBeat to store its data, including pointers to previously processed files.
- Line 100 to 114: The filebeat configuration file, which indicates the output, ElasticSearch, and activate the Traefik module.
Once we apply this description file, we have traefik which generates logs that are sent to ElasticSearch every 30 seconds (default configuration of FileBeat's Traefik module).
3rd step: Deployment of Grafana
Now that we are extracting and storing our accesslogs, we will now deploy Grafana, which will allow us to return them.
As a prerequisite, I created on my host a directory "/home/kube/grafana/data" which will be used to persist the data of Grafana, and in particular the dashboards.
So, once again, we create a description file for Kubernetes, containing the following information:
apiVersion: apps/v1beta1
kind: Deployment
metadata:
  name: grafana
  labels:
    app: grafana
spec:
  replicas: 1
  template:
    metadata:
      labels:
        app: grafana
    spec:
      containers:
      - name: grafana
        volumeMounts:
        - name: grafana-data-storage
          mountPath: /var/lib/grafana
        image: grafana/grafana:6.5.2
        imagePullPolicy: Always
        ports:
        - containerPort: 3000
        env:
        - name: GF_INSTALL_PLUGINS
          value: "grafana-worldmap-panel 0.2.1,grafana-piechart-panel 1.3.9"
        resources:
          limits:
            cpu: "0.5"
            memory: "512Mi"
      volumes:
      - name: grafana-data-storage
        hostPath:
          path: /home/kube/grafana/data
          type: Directory

---

kind: Service
apiVersion: v1
metadata:
  labels:
    app: grafana
  name: grafana
spec:
  type: ClusterIP
  ports:
  - port: 3000
    name: http
  selector:
    app: grafana
So we can see in this code:
- The deployment of Grafana
- The installation of complementary plugins: WorldMap Panel (allowing to have a map with the points) and PieChart Panel, allowing to have a "pie chart".
- The creation and use of persistent volume
- The creation of a service allowing to expose it via Traefik, not described here because it is identical to my previous article.
Step 4: Configure Grafana to connect to ElasticSearch
Once our Grafana is deployed, we can connect to it with the super couple login/password : admin/admin .
We then create a strong password for Grafana.
Now we can add our first data source: ElasticSearch, which we will configure as follows :
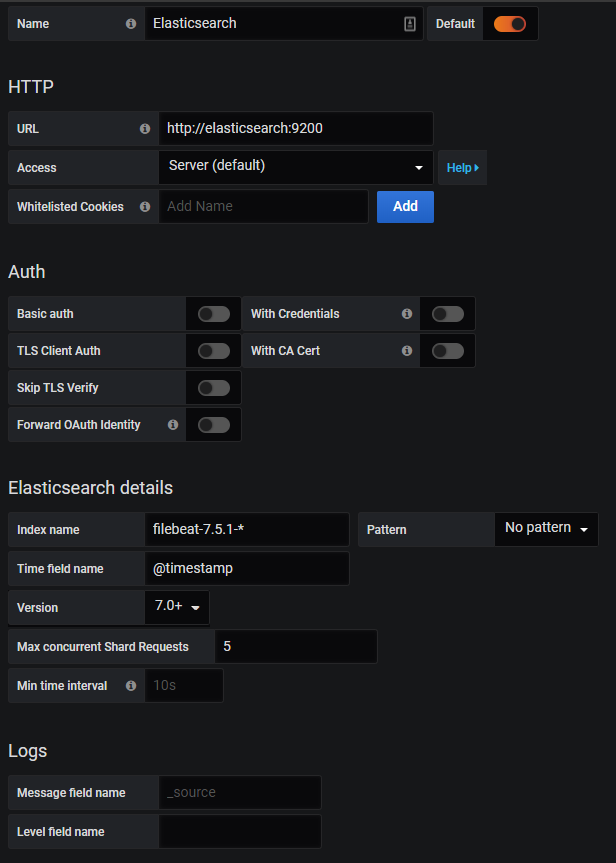
With this configuration, we will:
- Connect Grafana to ElasticSearch via the previously created service
- Specify the default index name of filebeat
- Indicate that it is an ElasticSearch version 7
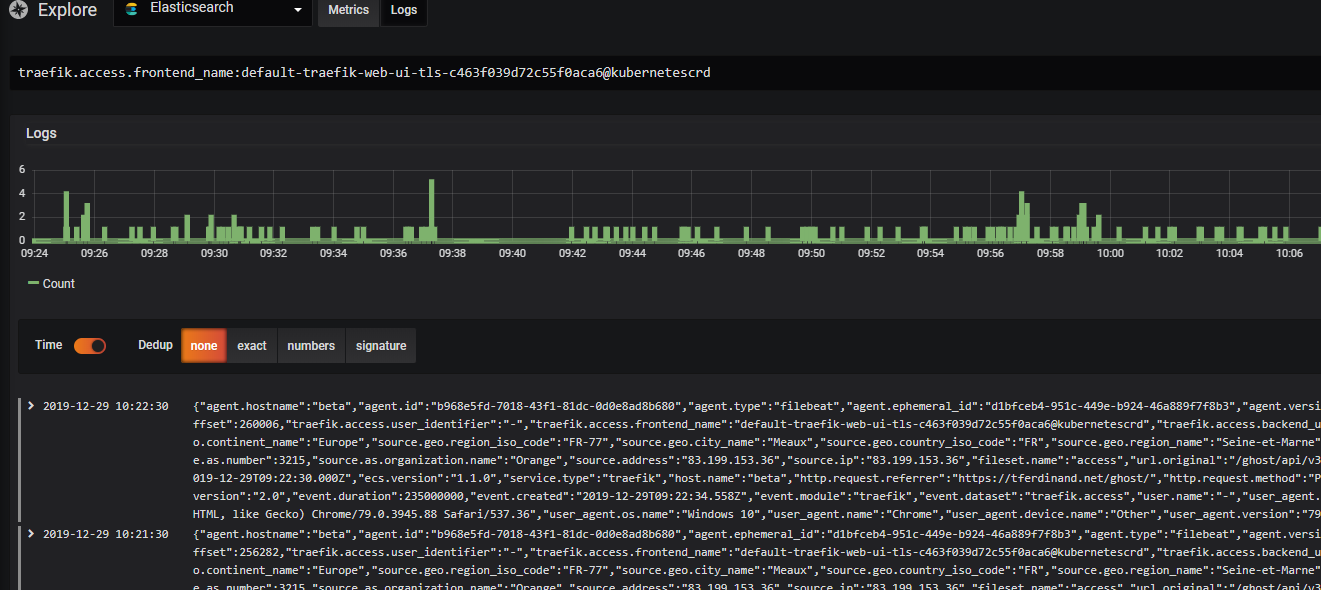
By then going to "Explore" and clicking on "Logs" at the top, you should now see your Traefik logs.
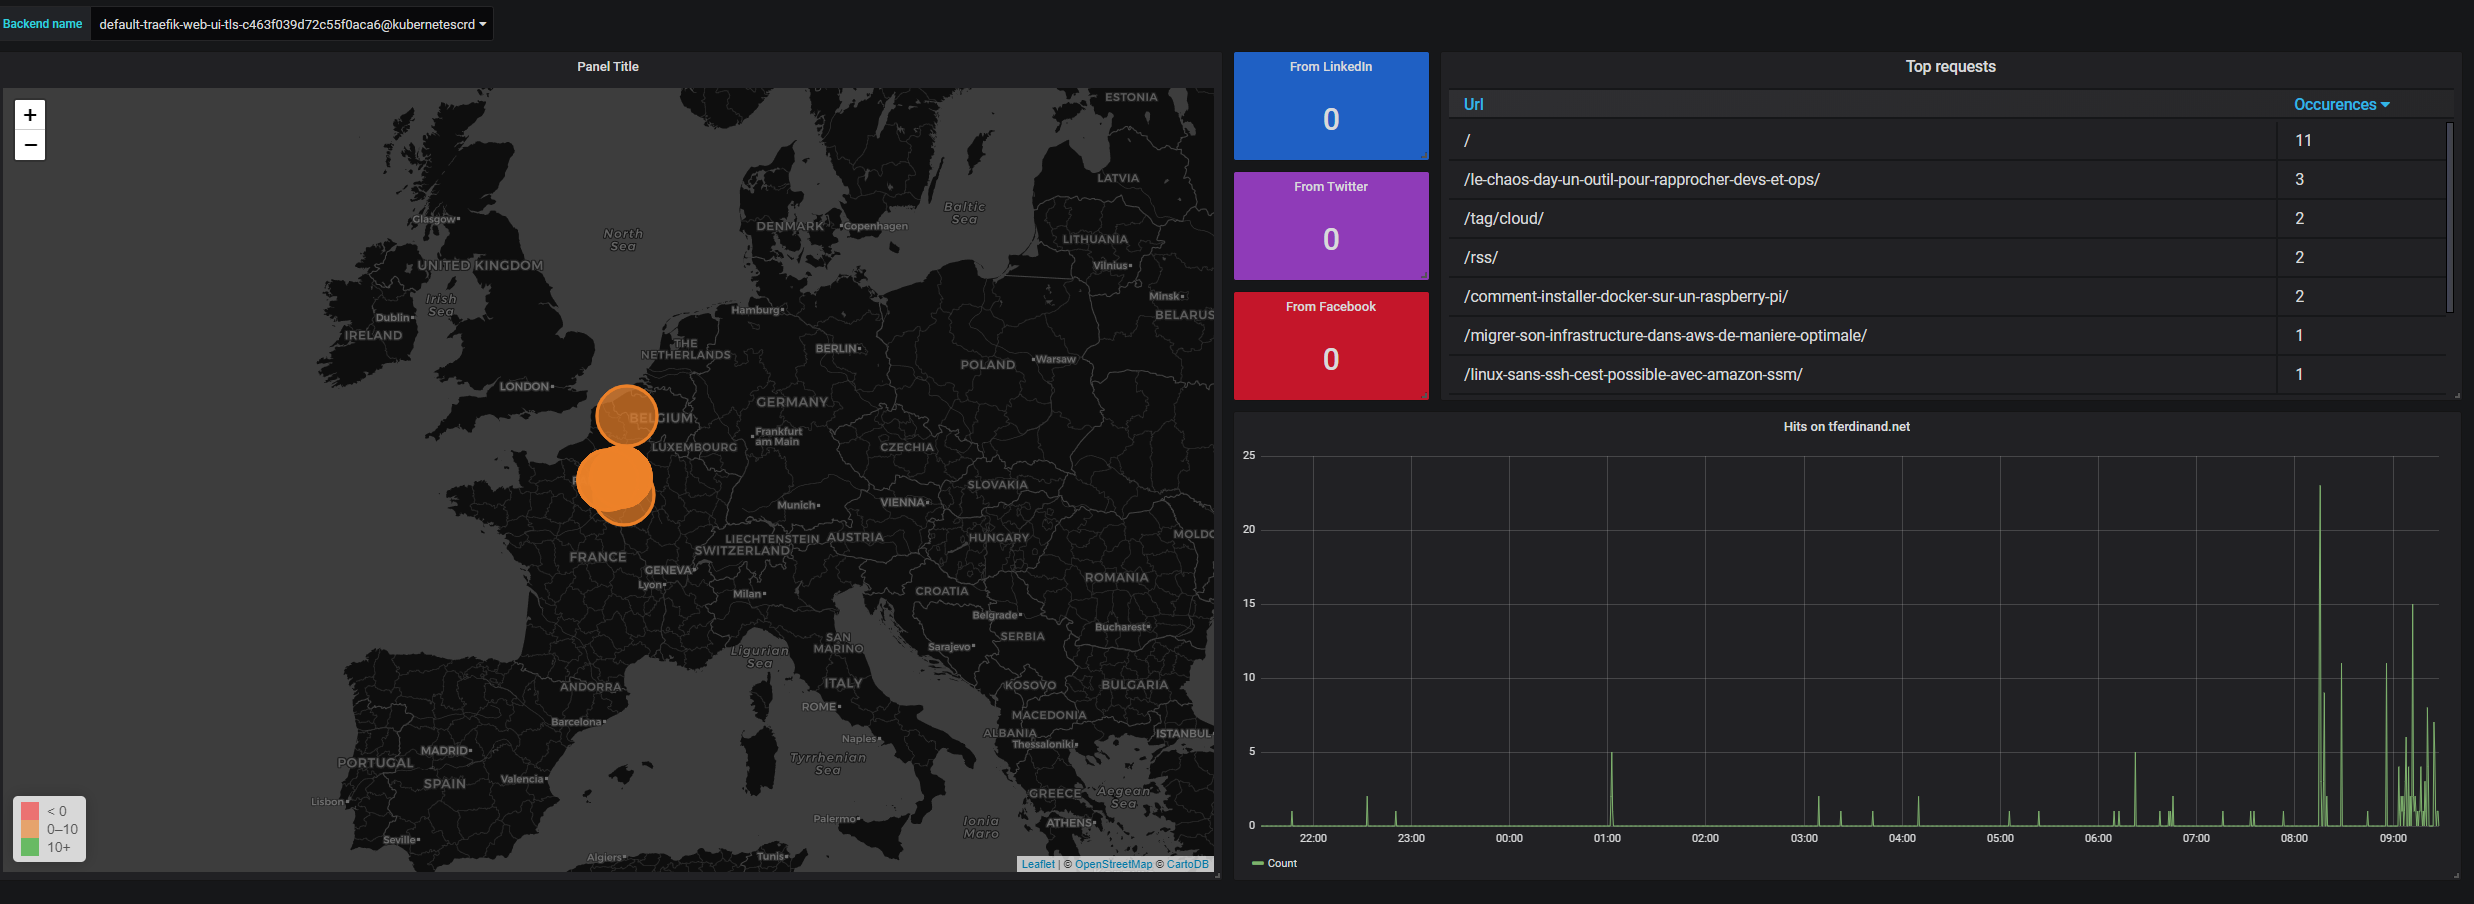
Finally
Now that we can exploit Traefik's accesslogs, it's quite easy to extract them to make a dashboard like I did.
Note that to query ElasticSearch, it is necessary to do it via the Lucene language, I use a cheat sheet available here.
As mentioned before, the purpose of this post is simply to describe the installation method I used, it is probably not perfect, and it is up to you to adapt it to your needs.


Comments ()